Background
What You Need to Know
Despite decades of production and widespread industrial use, the full scope and scale of PFAS contamination in the United States remains unknown. Nationwide drinking water testing has been limited, and no comprehensive site testing or source identification program currently exists at the federal level. States with more rigorous testing programs — like New Hampshire, California, and Michigan — have identified far more PFAS contamination sites than states with limited programs, creating a systematically skewed national picture.
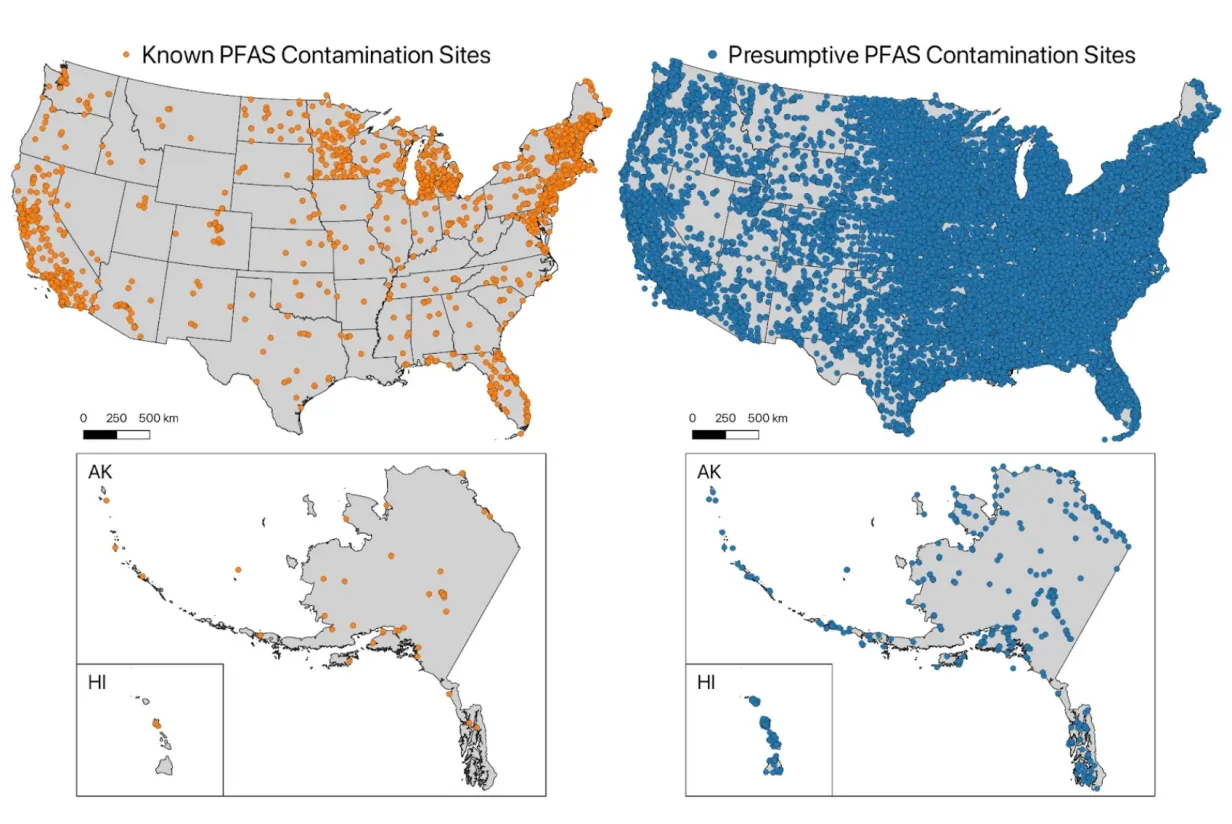
This research provides the first nationwide characterization of the landscape of PFAS contamination using two publicly available data sets: the PFAS Project Lab's Known PFAS Contamination Tracker (2,219 documented sites) and a Presumptive PFAS Contamination Model (79,891 sites of likely contamination). Together, they offer the most comprehensive picture of PFAS sources and their geographic distribution ever assembled.
Methodology
What Did the Researchers Do?
The researchers analyzed two national data sets developed by the PFAS Project Lab at Northeastern University. The Known PFAS Contamination Tracker documents confirmed environmental PFAS detections linked to identified sources, classified into six site categories: airports, industrial facilities, military facilities, municipal fire activity (AFFF use), waste facilities, and unknown.
The Presumptive PFAS Contamination Model applies a novel framework: where high-quality testing data is unavailable, PFAS contamination is presumed at sites with established patterns of PFAS use — AFFF discharge sites, certain industrial facilities, and PFAS-containing waste sites. Both data sets were updated in 2025 using EPA PFAS Analytic Tools data, adding 280 net known sites and over 22,000 net presumptive sites.
For spatial analysis, the team used QGIS and ArcGIS to map presumptive site density at the county level, then applied Anselin's Local Moran's I statistic to identify statistically significant clusters of high and low contamination density — at both national and EPA Regional scales.
Data Set Scale
The presumptive data set is explicitly conservative — it only maps sites where contamination is probable, not merely possible. Site types like biosolids application on farmland, which lack systematic geolocation data, are excluded entirely. The true scale of U.S. PFAS contamination is therefore significantly larger than the 79,891 sites captured here.
Findings — Known Sites
Sources, Concentrations & the AFFF Problem
Every Site Category Exceeds Safety Limits
Across all 2,219 documented sites and all PFAS measures, the median groundwater PFAS concentrations exceeded EPA's 4 ppt MCLs for PFOA and PFOS. Only 6% of maximum PFOA detections and 6% of maximum PFOS detections fell below 4 ppt. This means that regardless of site type — military, industrial, waste, airport, or fire activity — contamination levels are typically unsafe by the EPA's own standard.
AFFF Users Show the Highest Contamination
Sites associated with aqueous film-forming foam (AFFF) — military facilities, airports, and municipal fire activity sites — are consistently associated with the highest PFAS groundwater concentrations, significantly higher than industrial and waste sites across all four PFAS measures (p < 0.0001). AFFF, a firefighting foam used extensively at military installations and airports, contains some of the highest concentrations of PFOS and PFOA of any PFAS application.
| Site Type | Share of Known Sites | Median Concentration | AFFF Association |
|---|---|---|---|
| Military Facilities | 20% (n=444) | Highest across all measures | Primary AFFF user |
| Airports | 4% (n=89) | Second highest | Primary AFFF user |
| Municipal Fire Activity | 4% (n=89) | Second highest | Primary AFFF user |
| Waste Facilities | 40% (n=888) | Below AFFF sites; still above MCL | Indirect (AFFF waste) |
| Industrial Facilities | 29% (n=644) | Below AFFF sites; still above MCL | Varies by sector |
Industrial Sources Are Undercounted
Of the 638 industrial sites in the known data set, metal manufacturing and coating account for the most (21%), followed by dry cleaners and laundry facilities (9%). However, industrial sites are significantly underrepresented in confirmed detections relative to their likely prevalence — 29% of known contamination sites are industrial, while 53% of presumptive contamination sites are industrial. This gap almost certainly reflects a lack of systematic testing, not a lack of actual contamination.
"94% of groundwater PFAS detections across all site types exceed the EPA's health-based limit. No site category is safe."
Findings — Presumptive Sites
The Full Scope of Likely Contamination
Of the 79,891 presumptive contamination sites, the majority are industrial (53%, n = 42,305). Within this category, metal manufacturing accounts for 36%, followed by chemical manufacturing (24%), printing and related activities (12%), and computer and electronic product manufacturing (3%). Waste facilities account for 42% of the data set.
The textile manufacturing sector illustrates the breadth of the reporting gap. This research identified 1,582 textile production presumptive PFAS sites — yet only 76 textile facilities reported data through EPA's Toxic Release Inventory in 2023. As many as 1,506 additional facilities may not be reporting PFAS emissions at all. Similar gaps likely exist across other industrial sectors.
- Metal manufacturing is the largest industrial source category in the presumptive data set; in the metal plating industry specifically, PFAS are used as mist suppressants — substituting one serious occupational hazard for another
- Waste facilities (42% of presumptive sites) include landfills, wastewater treatment plants, and incinerators — sites that concentrate and redistribute PFAS from multiple upstream sources
- Military sites and AFFF discharges together represent only 4% of presumptive sites but are associated with the highest confirmed contamination levels — warranting immediate, prioritized action
- Rural contamination from biosolids application on farmland is systematically excluded from the presumptive data set due to a lack of geolocation data — meaning rural PFAS exposure is substantially undercounted
Implications
How Can You Use This Research?
This research supports multiscale approaches to PFAS remediation — from federal testing requirements to local community outreach. By identifying clusters of high contamination site density, the analysis can help governments, water systems, and NGOs prioritize testing, site investigations, and remediation efforts.
The findings carry particular urgency for communities near military installations, airports, and firefighter training facilities, where AFFF use has produced the highest confirmed groundwater contamination levels. Swift, public health-protective action is needed at all current and former AFFF use sites — and high-performance nonfluorinated alternatives to AFFF are already available.
The spatial cluster analyses have environmental justice implications: high contamination site density is correlated with urban areas and population density, and PFAS-impacted water systems are significantly more likely to serve communities of color. Incorporating presumptive modeling into cumulative risk tools like EPA's EJScreen could reveal exposure burdens currently invisible to regulators and affected communities.
For industrial regulation, this research points to a critical need for expanded testing beyond the AFFF-focused programs that dominate current federal efforts. Without systematic testing of industrial sites — which represent over half of all presumptive contamination sources — the true scope of U.S. PFAS contamination will remain unknown.